> ## Documentation Index
> Fetch the complete documentation index at: https://wb-21fd5541-feature-automate-reference-docs-generation.mintlify.site/llms.txt
> Use this file to discover all available pages before exploring further.

# Tracing Quickstart

> Track and monitor your AI application's execution with Weave tracing

![Weave Calls Screenshot](https://mintlify.s3.us-west-1.amazonaws.com/wb-21fd5541-feature-automate-reference-docs-generation/images/screenshots/calls_macro.png)

![Weave Calls Screenshot](https://mintlify.s3.us-west-1.amazonaws.com/wb-21fd5541-feature-automate-reference-docs-generation/images/screenshots/basic_call.png)

![Weave Calls Screenshot](https://mintlify.s3.us-west-1.amazonaws.com/wb-21fd5541-feature-automate-reference-docs-generation/images/screenshots/calls_filter.png)

<Info>
  **Calls**
  Calls are the fundamental building block in Weave. They represent a single execution of a function, including:

  * Inputs (arguments)
  * Outputs (return value)
  * Metadata (duration, exceptions, LLM usage, etc.)

  Calls are similar to spans in the [OpenTelemetry](https://opentelemetry.io) data model. A Call can:

  * Belong to a Trace (a collection of calls in the same execution context)
  * Have parent and child Calls, forming a tree structure
</Info>

## Creating Calls

There are three main ways to create Calls in Weave:

### 1. Automatic tracking of LLM libraries

<Tabs>
  <Tab title="Python">
    Weave automatically tracks [calls to common LLM libraries](../integrations/index.mdx) like `openai`, `anthropic`, `cohere`, and `mistral`. Simply call [`weave.init('project_name')`](../../reference/python-sdk/weave/index.md#function-init) at the start of your program:

    <Tip>
      You can control Weave's default tracking behavior [using the `autopatch_settings` argument in `weave.init`](#configure-autopatching).
    </Tip>

    ```python showLineNumbers
    import weave

    from openai import OpenAI
    client = OpenAI()

    # Initialize Weave Tracing
    weave.init('intro-example')

    response = client.chat.completions.create(
        model="gpt-4",
        messages=[
            {
                "role": "user",
                "content": "How are you?"
            }
        ],
        temperature=0.8,
        max_tokens=64,
        top_p=1,
    )
    ```
  </Tab>

  <Tab title="TypeScript">
    Weave automatically tracks [calls to common LLM libraries](../integrations/index.mdx), such as `openai`.

    ```typescript showLineNumbers
    import OpenAI from 'openai'
    import * as weave from 'weave'

    const client = new OpenAI()

    // Initialize Weave Tracing
    await weave.init('intro-example')

    const response = await client.chat.completions.create({
      model: 'gpt-4',
      messages: [
        {
          role: 'user',
          content: 'How are you?',
        },
      ],
      temperature: 0.8,
      max_tokens: 64,
      top_p: 1,
    });
    ```

    For a complete setup guide for JS / TS projects, see the [TypeScript SDK: Third-Party Integration Guide](../integrations/js.mdx).
  </Tab>
</Tabs>

#### Summary

You can store metrics or other post-call values in the `summary`
dictionary of a Call. Modify `call.summary` during execution and any
values you add will be merged with Weave's computed summary data when
the call finishes.

### 2. Decorating and wrapping functions

However, often LLM applications have additional logic (such as pre/post processing, prompts, etc.) that you want to track.

<Tabs>
  <Tab title="Python">
    Weave allows you to manually track these calls using the [`@weave.op`](../../reference/python-sdk/weave/index.md#function-op) decorator. For example:

    ```python showLineNumbers
    import weave

    # Initialize Weave Tracing
    weave.init('intro-example')

    # Decorate your function
    @weave.op
    def my_function(name: str):
        return f"Hello, {name}!"

    # Call your function -- Weave will automatically track inputs and outputs
    print(my_function("World"))
    ```

    You can also track [methods on classes](#4-track-class-and-object-methods).

    #### Trace sync & async generator functions

    Weave supports tracing both sync and async generator functions, including deeply nested patterns.

    <Warning>
      Since generators yield values lazily, the outputs are only logged when the generator is fully consumed (e.g., by converting it to a list).
      To ensure outputs are captured in the trace, fully consume the generator (e.g., by using `list()`).
    </Warning>

    ```python showLineNumbers
    from typing import Generator
    import weave

    weave.init("my-project")

    # This function uses a simple sync generator.
    # Weave will trace the call and its input (`x`), 
    # but output values are only captured once the generator is consumed (e.g., via `list()`).
    @weave.op
    def basic_gen(x: int) -> Generator[int, None, None]:
        yield from range(x)

    # A normal sync function used within the generator pipeline.
    # Its calls are also traced independently by Weave.
    @weave.op
    def inner(x: int) -> int:
        return x + 1

    # A sync generator that calls another traced function (`inner`).
    # Each yielded value comes from a separate traced call to `inner`.
    @weave.op
    def nested_generator(x: int) -> Generator[int, None, None]:
        for i in range(x):
            yield inner(i)

    # A more complex generator that composes the above generator.
    # Tracing here produces a hierarchical call tree:
    # - `deeply_nested_generator` (parent)
    #   - `nested_generator` (child)
    #     - `inner` (grandchild)
    @weave.op
    def deeply_nested_generator(x: int) -> Generator[int, None, None]:
        for i in range(x):
            for j in nested_generator(i):
                yield j

    # The generator must be *consumed* for Weave to capture outputs.
    # This is true for both sync and async generators.
    res = deeply_nested_generator(4)
    list(res)  # Triggers tracing of all nested calls and yields
    ```

    ![Tracing generator functions in Weave.](https://mintlify.s3.us-west-1.amazonaws.com/wb-21fd5541-feature-automate-reference-docs-generation/guides/tracking/imgs/generators.png)
  </Tab>

  <Tab title="TypeScript">
    Weave allows you to manually track these calls by wrapping your function with [`weave.op`](../../reference/typescript-sdk/weave/functions/op.mdx). For example:

    ```typescript showLineNumbers
    import * as weave from 'weave'

    await weave.init('intro-example')

    function myFunction(name: string) {
        return `Hello, ${name}!`
    }

    const myFunctionOp = weave.op(myFunction)
    ```

    You can also define the wrapping inline:

    ```typescript
    const myFunctionOp = weave.op((name: string) => `Hello, ${name}!`)
    ```

    This works for both functions as well as methods on classes:

    ```typescript
    class MyClass {
        constructor() {
            this.myMethod = weave.op(this.myMethod)
        }

        myMethod(name: string) {
            return `Hello, ${name}!`
        }
    }
    ```
  </Tab>
</Tabs>

#### Getting a handle to the call object during execution

<Tabs>
  <Tab title="Python">
    Sometimes it is useful to get a handle to the `Call` object itself. You can do this by calling the `op.call` method, which returns both the result and the `Call` object. For example:

    ```python showLineNumbers
    result, call = my_function.call("World")
    ```

    Then, `call` can be used to set / update / fetch additional properties (most commonly used to get the ID of the call to be used for feedback).

    <Note>
      If your op is a method on a class, you need to pass the instance as the first argument to the op (see example below).
    </Note>

    ```python showLineNumbers
    # Notice that we pass the `instance` as the first argument.
    print(instance.my_method.call(instance, "World"))
    ```

    ```python showLineNumbers
    import weave

    # Initialize Weave Tracing
    weave.init("intro-example")

    class MyClass:
        # Decorate your method
        @weave.op
        def my_method(self, name: str):
            return f"Hello, {name}!"

    instance = MyClass()

    # Call your method -- Weave will automatically track inputs and outputs
    instance.my_method.call(instance, "World")
    ```
  </Tab>

  <Tab title="TypeScript">
    ```plaintext
    This feature is not available in TypeScript yet.  Stay tuned!
    ```
  </Tab>
</Tabs>

#### Call display name

<Tabs>
  <Tab title="Python">
    Sometimes you may want to override the display name of a call. You can achieve this in one of four ways:

    1. Change the display name at the time of calling the op:

    ```python showLineNumbers
    result = my_function("World", __weave={"display_name": "My Custom Display Name"})
    ```

    <Note>
      Using the `__weave` dictionary sets the call display name which will take precedence over the Op display name.
    </Note>

    2. Change the display name on a per-call basis. This uses the [`Op.call`](../../reference/python-sdk/weave/trace/weave.trace.op.md#function-call) method to return a `Call` object, which you can then use to set the display name using [`Call.set_display_name`](../../reference/python-sdk/weave/trace/weave.trace.weave_client.md#method-set_display_name).

    ```python showLineNumbers
    result, call = my_function.call("World")
    call.set_display_name("My Custom Display Name")
    ```

    3. Change the display name for all Calls of a given Op:

    ```python showLineNumbers
    @weave.op(call_display_name="My Custom Display Name")
    def my_function(name: str):
        return f"Hello, {name}!"
    ```

    4. The `call_display_name` can also be a function that takes in a `Call` object and returns a string.  The `Call` object will be passed automatically when the function is called, so you can use it to dynamically generate names based on the function's name, call inputs, fields, etc.

    5. One common use case is just appending a timestamp to the function's name.

       ```py
       from datetime import datetime

       @weave.op(call_display_name=lambda call: f"{call.func_name}__{datetime.now()}")
       def func():
           return ...
       ```

    6. You can also log custom metadata using `.attributes`

       ```py
       def custom_attribute_name(call):
           model = call.attributes["model"]
           revision = call.attributes["revision"]
           now = call.attributes["date"]

           return f"{model}__{revision}__{now}"

       @weave.op(call_display_name=custom_attribute_name)
       def func():
           return ...

       with weave.attributes(
           {
               "model": "finetuned-llama-3.1-8b",
               "revision": "v0.1.2",
               "date": "2024-08-01",
           }
       ):
           func()  # the display name will be "finetuned-llama-3.1-8b__v0.1.2__2024-08-01"

           with weave.attributes(
               {
                   "model": "finetuned-gpt-4o",
                   "revision": "v0.1.3",
                   "date": "2024-08-02",
               }
           ):
               func()  # the display name will be "finetuned-gpt-4o__v0.1.3__2024-08-02"
       ```

    **Technical Note:** "Calls" are produced by "Ops". An Op is a function or method that is decorated with `@weave.op`.
    By default, the Op's name is the function name, and the associated calls will have the same display name. The above example shows how to override the display name for all Calls of a given Op.  Sometimes, users wish to override the name of the Op itself. This can be achieved in one of two ways:

    1. Set the `name` property of the Op before any calls are logged

    ```python showLineNumbers
    my_function.name = "My Custom Op Name"
    ```

    2. Set the `name` option on the op decorator

    ```python showLineNumbers
    @weave.op(name="My Custom Op Name)
    ```
  </Tab>

  <Tab title="TypeScript">
    ```plaintext
    This feature is not available in TypeScript yet.  Stay tuned!
    ```
  </Tab>
</Tabs>

#### Attributes

<Tabs>
  <Tab title="Python">
    When calling tracked functions, you can add additional metadata to the call by using [`weave.attributes`](../../reference/python-sdk/weave/index.md#function-attributes) context manager. In the example below, we add an `env` attribute to the call specified as `'production'`.

    ```python showLineNumbers
    # ... continued from above ...

    # Add additional attributes to the call
    with weave.attributes({'env': 'production'}):
        print(my_function.call("World"))
    ```

    <Tip>
      `call.attributes` cannot be modified once the call starts. Use this
      context manager to set any metadata before invoking the op.
    </Tip>
  </Tab>

  <Tab title="TypeScript">
    ```plaintext
    This feature is not available in TypeScript yet.  Stay tuned!
    ```
  </Tab>
</Tabs>

#### Trace parallel (multi-threaded) function calls

<Tabs>
  <Tab title="Python">
    By default, parallel calls all show up in Weave as separate root calls. To get correct nesting under the same parent `op`, use [`ThreadPoolExecutor`](../../reference/python-sdk/weave/trace/weave.trace.util/#class-contextawarethreadpoolexecutor).

    The following code sample demonstrates the use of `ThreadPoolExecutor`.
    The first function, `func`, is a simple `op` that takes `x` and returns `x+1`. The second function, `outer`, is another `op` that accepts a list of inputs.
    Inside `outer`, the use of `ThreadPoolExecutor` and `exc.map(func, inputs)` means that each call to `func` still carries the same parent trace context.

    ```python
    import weave

    @weave.op
    def func(x):
        return x+1

    @weave.op
    def outer(inputs):
        with weave.ThreadPoolExecutor() as exc:
            exc.map(func, inputs)

    # Update your Weave project name  
    client = weave.init('my-weave-project')
    outer([1,2,3,4,5])
    ```

    In the Weave UI, this produces a single parent call with five nested child calls, so that you get a fully hierarchical trace even though the increments run in parallel.

    ![The Trace UI, showing a single parent call for outer, with five nested child calls.](https://mintlify.s3.us-west-1.amazonaws.com/wb-21fd5541-feature-automate-reference-docs-generation/guides/tracking/imgs/threadpoolexecutor.png)
  </Tab>
</Tabs>

### 3. Manual Call tracking

You can also manually create Calls using the API directly.

<Tabs>
  <Tab title="Python">
    ```python showLineNumbers
    import weave

    # Initialize Weave Tracing
    client = weave.init('intro-example')

    def my_function(name: str):
        # Start a call
        call = client.create_call(op="my_function", inputs={"name": name})

        # ... your function code ...

        # End a call
        client.finish_call(call, output="Hello, World!")

    # Call your function
    print(my_function("World"))
    ```
  </Tab>

  <Tab title="TypeScript">
    ```plaintext
    This feature is not available in TypeScript yet.  Stay tuned!
    ```
  </Tab>

  <Tab title="HTTP API">
    * Start a call: [POST `/call/start`](../../reference/service-api/call-start-call-start-post.api.mdx)
    * End a call: [POST `/call/end`](../../reference/service-api/call-end-call-end-post.api.mdx)

    ```bash
    curl -L 'https://trace.wandb.ai/call/start' \
    -H 'Content-Type: application/json' \
    -H 'Accept: application/json' \
    -d '{
        "start": {
            "project_id": "string",
            "id": "string",
            "op_name": "string",
            "display_name": "string",
            "trace_id": "string",
            "parent_id": "string",
            "started_at": "2024-09-08T20:07:34.849Z",
            "attributes": {},
            "inputs": {},
            "wb_run_id": "string"
        }
    }
    ```
  </Tab>
</Tabs>

### 4. Track class and object methods

You can also track class and object methods.

<Tabs>
  <Tab title="Python">
    Track any method on a class using `weave.op`.

    ```python showLineNumbers
    import weave

    # Initialize Weave Tracing
    weave.init("intro-example")

    class MyClass:
        # Decorate your method
        @weave.op
        def my_method(self, name: str):
            return f"Hello, {name}!"

    instance = MyClass()

    # Call your method -- Weave will automatically track inputs and outputs
    print(instance.my_method("World"))
    ```
  </Tab>

  <Tab title="TypeScript">
    <Important>
      **Using decorators in TypeScript**

      To use the `@weave.op` decorator with your TypeScript code, make sure your environment is properly configured:

      * **TypeScript v5.0 or newer**: Decorators are supported out of the box and no additional configuration is required.
      * **TypeScript older than v5.0**: Enable experimental support for decorators. For more details, see the [official TypeScript documentation on decorators](https://www.typescriptlang.org/docs/handbook/decorators.html).
    </Important>

    #### Decorate a class method

    Use `@weave.op` to trace instance methods.

    ```typescript
    class Foo {
        @weave.op
        async predict(prompt: string) {
            return "bar"
        }
    }
    ```

    #### Decorate a static class method

    Apply `@weave.op` to static methods to monitor utility functions within a class.

    ```typescript
    class MathOps {
        @weave.op
        static square(n: number): number {
            return n * n;
        }
    }
    ```
  </Tab>
</Tabs>

## Viewing Calls

<Tabs>
  <Tab title="Web App">
    To view a call in the web app:

    1. Navigate to your project's "Traces" tab
    2. Find the call you want to view in the list
    3. Click on the call to open its details page

    The details page will show the call's inputs, outputs, runtime, and any additional metadata.

    ![View Call in Web App](https://mintlify.s3.us-west-1.amazonaws.com/wb-21fd5541-feature-automate-reference-docs-generation/images/screenshots/basic_call.png)
  </Tab>

  <Tab title="Python">
    To view a call using the Python API, you can use the [`get_call`](../../reference/python-sdk/weave/trace/weave.trace.weave_client#method-get_call) method:

    ```python
    import weave

    # Initialize the client
    client = weave.init("your-project-name")

    # Get a specific call by its ID
    call = client.get_call("call-uuid-here")

    print(call)
    ```

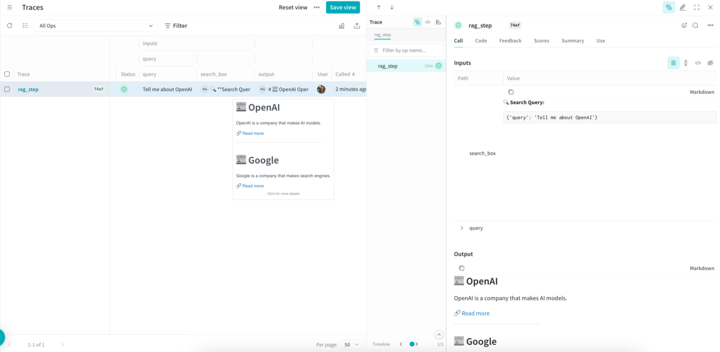
    ### Customize rendered traces with `weave.Markdown`

    Weave makes it easy to tailor how your traced operations are displayed without losing the original data.
    With `weave.Markdown`, you can render inputs and outputs as clean, readable blocks of formatted content while preserving the underlying structured data for programmatic access.
    Use `postprocess_inputs` and `postprocess_output` in your `@weave.op` decorator to enhance trace readability.

    The following code sample uses postprocessors to render a call in Weave to with emojis and nicer formatting:

    <pre>
      ```python
      import weave

      def postprocess_inputs(query) -> weave.Markdown:
          search_box = f"""
      **Search Query:**
      ``+`
      {query}
      ``+`
      """
          return {"search_box": weave.Markdown(search_box),
                  "query": query}

      def postprocess_output(docs) -> weave.Markdown:
          formatted_docs = f"""
      # {docs[0]["title"]}

      {docs[0]["content"]}

      [Read more]({docs[0]["url"]})

      ---

      # {docs[1]["title"]}

      {docs[1]["content"]}

      [Read more]({docs[1]["url"]})
      """
          return weave.Markdown(formatted_docs)

      @weave.op(
          postprocess_inputs=postprocess_inputs,
          postprocess_output=postprocess_output,
      )
      def rag_step(query):
          # example newspaper articles of the companies on the S&P 500 
          docs = [
              {
                  "title": "OpenAI",
                  "content": "OpenAI is a company that makes AI models.",
                  "url": "https://www.openai.com",
              },
              {
                  "title": "Google",
                  "content": "Google is a company that makes search engines.",
                  "url": "https://www.google.com",
              },
          ]
          return docs

      if __name__ == "__main__":
          weave.init('markdown_renderers')
          rag_step("Tell me about OpenAI")
      ```
    </pre>

    ![A call rendered in the Weave UI using the code sample.](https://mintlify.s3.us-west-1.amazonaws.com/wb-21fd5541-feature-automate-reference-docs-generation/guides/tracking/imgs/md-call-render.png)
  </Tab>

  <Tab title="TypeScript">
    ```typescript showLineNumbers
    import * as weave from 'weave'

    // Initialize the client
    const client = await weave.init('intro-example')

    // Get a specific call by its ID
    const call = await client.getCall('call-uuid-here')

    console.log(call)
    ```
  </Tab>

  <Tab title="HTTP API">
    To view a call using the Service API, you can make a request to the [`/call/read`](../../reference/service-api/call-read-call-read-post.api.mdx) endpoint.

    ```bash
    curl -L 'https://trace.wandb.ai/call/read' \
    -H 'Content-Type: application/json' \
    -H 'Accept: application/json' \
    -d '{
        "project_id": "string",
        "id": "string",
    }'
    ```
  </Tab>
</Tabs>

## Updating Calls

Calls are mostly immutable once created, however, there are a few mutations which are supported:

* [Set Display Name](#set-display-name)
* [Add Feedback](#add-feedback)
* [Delete a Call](#delete-a-call)

All of these mutations can be performed from the UI by navigating to the call detail page:

![Update Call in Web App](https://mintlify.s3.us-west-1.amazonaws.com/wb-21fd5541-feature-automate-reference-docs-generation/images/call_edit_screenshot.png)

### Set display name

<Tabs>
  <Tab title="Python">
    In order to set the display name of a call, you can use the [`Call.set_display_name`](../../reference/python-sdk/weave/trace/weave.trace.weave_client.md#method-set_display_name) method.

    ```python showLineNumbers
    import weave

    # Initialize the client
    client = weave.init("your-project-name")

    # Get a specific call by its ID
    call = client.get_call("call-uuid-here")

    # Set the display name of the call
    call.set_display_name("My Custom Display Name")
    ```
  </Tab>

  <Tab title="TypeScript">
    ```plaintext
    This feature is not available in TypeScript yet.  Stay tuned!
    ```
  </Tab>

  <Tab title="HTTP API">
    To set the display name of a call using the Service API, you can make a request to the [`/call/update`](../../reference/service-api/call-update-call-update-post.api.mdx) endpoint.

    ```bash
    curl -L 'https://trace.wandb.ai/call/update' \
    -H 'Content-Type: application/json' \
    -H 'Accept: application/json' \
    -d '{
        "project_id": "string",
        "call_id": "string",
        "display_name": "string",
    }'
    ```
  </Tab>
</Tabs>

### Add feedback

Please see the [Feedback Documentation](./feedback.mdx) for more details.

### Delete a Call

<Tabs>
  <Tab title="Python">
    To delete a Call using the Python API, you can use the [`Call.delete`](../../reference/python-sdk/weave/trace/weave.trace.weave_client.md#method-delete) method.

    ```python showLineNumbers
    import weave

    # Initialize the client
    client = weave.init("your-project-name")

    # Get a specific call by its ID
    call = client.get_call("call-uuid-here")

    # Delete the call
    call.delete()
    ```
  </Tab>

  <Tab title="TypeScript">
    ```plaintext
    This feature is not available in TypeScript yet.  Stay tuned!
    ```
  </Tab>

  <Tab title="HTTP API">
    To delete a call using the Service API, you can make a request to the [`/calls/delete`](../../reference/service-api/calls-delete-calls-delete-post.api.mdx) endpoint.

    ```bash
    curl -L 'https://trace.wandb.ai/calls/delete' \
    -H 'Content-Type: application/json' \
    -H 'Accept: application/json' \
    -d '{
        "project_id": "string",
        "call_ids": [
            "string"
        ],
    }'
    ```
  </Tab>
</Tabs>

### Delete multiple Calls

<Tabs>
  <Tab title="Python">
    To delete batches of Calls using the Python API, pass a list of Call IDs to `delete_calls()`.

    <Important>
      * The maximum amount of Calls that can be deleted is `1000`.
      * Deleting a Call also deletes all of its children.
    </Important>

    ```python showLineNumbers
    import weave

    # Initialize the client
    client = weave.init("my-project")

    # Get all calls from client 
    all_calls = client.get_calls()

    # Get list of first 1000 Call objects
    first_1000_calls = all_calls[:1000]

    # Get list of first 1000 Call IDs
    first_1000_calls_ids = [c.id for c in first_1000_calls]

    # Delete first 1000 Call objects by ID
    client.delete_calls(call_ids=first_1000_calls_ids)
    ```
  </Tab>

  <Tab title="TypeScript">
    ```plaintext
    This feature is not available in TypeScript yet.  Stay tuned!
    ```
  </Tab>
</Tabs>

## Querying and exporting Calls

![Screenshot of many calls](https://mintlify.s3.us-west-1.amazonaws.com/wb-21fd5541-feature-automate-reference-docs-generation/images/screenshots/calls_filter.png)

The `/calls` page of your project ("Traces" tab) contains a table view of all the Calls in your project. From there, you can:

* Sort
* Filter
* Export

![Calls Table View](https://mintlify.s3.us-west-1.amazonaws.com/wb-21fd5541-feature-automate-reference-docs-generation/images/export_modal.png)

The Export Modal (shown above) allows you to export your data in a number of formats, as well as shows the Python & CURL equivalents for the selected calls!
The easiest way to get started is to construct a view in the UI, then learn more about the export API via the generated code snippets.

<Tabs>
  <Tab title="Python">
    To fetch calls using the Python API, you can use the [`client.get_calls`](../../reference/python-sdk/weave/trace/weave.trace.weave_client.md#method-get_calls) method:

    ```python
    import weave

    # Initialize the client
    client = weave.init("your-project-name")

    # Fetch calls
    calls = client.get_calls(filter=...)
    ```
  </Tab>

  <Tab title="TypeScript">
    To fetch calls using the TypeScript API, you can use the [`client.getCalls`](../../reference/typescript-sdk/weave/classes/WeaveClient#getcalls) method.

    ```typescript
    import * as weave from 'weave'

    // Initialize the client
    const client = await weave.init('intro-example')

    // Fetch calls
    const calls = await client.getCalls(filter=...)
    ```
  </Tab>

  <Tab title="HTTP API">
    The most powerful query layer is at the Service API. To fetch calls using the Service API, you can make a request to the [`/calls/stream_query`](../../reference/service-api/calls-query-stream-calls-stream-query-post.api.mdx) endpoint.

    ```bash
    curl -L 'https://trace.wandb.ai/calls/stream_query' \
    -H 'Content-Type: application/json' \
    -H 'Accept: application/json' \
    -d '{
    "project_id": "string",
    "filter": {
        "op_names": [
            "string"
        ],
        "input_refs": [
            "string"
        ],
        "output_refs": [
            "string"
        ],
        "parent_ids": [
            "string"
        ],
        "trace_ids": [
            "string"
        ],
        "call_ids": [
            "string"
        ],
        "trace_roots_only": true,
        "wb_user_ids": [
            "string"
        ],
        "wb_run_ids": [
            "string"
        ]
    },
    "limit": 100,
    "offset": 0,
    "sort_by": [
        {
        "field": "string",
        "direction": "asc"
        }
    ],
    "query": {
        "$expr": {}
    },
    "include_costs": true,
    "include_feedback": true,
    "columns": [
        "string"
    ],
    "expand_columns": [
        "string"
    ]
    }'
    ```
  </Tab>
</Tabs>

### Call schema

Please see the [schema](../../reference/python-sdk/weave/trace_server/weave.trace_server.trace_server_interface#class-callschema) for a complete list of fields.

| Property      | Type                  | Description                                                                                        |
| ------------- | --------------------- | -------------------------------------------------------------------------------------------------- |
| id            | string (uuid)         | Unique identifier for the call                                                                     |
| project\_id   | string (optional)     | Associated project identifier                                                                      |
| op\_name      | string                | Name of the operation (can be a reference)                                                         |
| display\_name | string (optional)     | User-friendly name for the call                                                                    |
| trace\_id     | string (uuid)         | Identifier for the trace this call belongs to                                                      |
| parent\_id    | string (uuid)         | Identifier of the parent call                                                                      |
| started\_at   | datetime              | Timestamp when the call started                                                                    |
| attributes    | Dict\[str, Any]       | User-defined metadata about the call *(read-only during execution)*                                |
| inputs        | Dict\[str, Any]       | Input parameters for the call                                                                      |
| ended\_at     | datetime (optional)   | Timestamp when the call ended                                                                      |
| exception     | string (optional)     | Error message if the call failed                                                                   |
| output        | Any (optional)        | Result of the call                                                                                 |
| summary       | Optional\[SummaryMap] | Post-execution summary information. You can modify this during execution to record custom metrics. |
| wb\_user\_id  | Optional\[str]        | Associated Weights & Biases user ID                                                                |
| wb\_run\_id   | Optional\[str]        | Associated Weights & Biases run ID                                                                 |
| deleted\_at   | datetime (optional)   | Timestamp of call deletion, if applicable                                                          |

The table above outlines the key properties of a Call in Weave. Each property plays a crucial role in tracking and managing function calls:

* The `id`, `trace_id`, and `parent_id` fields help in organizing and relating calls within the system.
* Timing information (`started_at`, `ended_at`) allows for performance analysis.
* The `attributes` and `inputs` fields provide context for the call. Attributes are frozen once the call starts, so set them before invocation with `weave.attributes`. `output` and `summary` capture the results, and you can update `summary` during execution to log additional metrics.
* Integration with Weights & Biases is facilitated through `wb_user_id` and `wb_run_id`.

This comprehensive set of properties enables detailed tracking and analysis of function calls throughout your project.

Calculated Fields:

* Cost
* Duration
* Status

## Saved views

You can save your Trace table configurations, filters, and sorts as *saved views* for quick access to your preferred setup. You can configure and access saved views via the UI and the Python SDK. For more information, see [Saved Views](/guides/tools/saved-views.mdx).

## View a W\&B run in the Traces table

With Weave, you can trace function calls in your code and link them directly to the [W\&B runs](https://docs.wandb.ai/guides/runs/) in which they were executed.
When you trace a function with @weave.op() and call it inside a wandb.init() context, Weave automatically associates the trace with the W\&B run.
Links to any associated runs are shown in the Traces table.

### Python example

The following Python code shows how traced operations are linked to W\&B
runs when executed inside a `wandb.init()` context. These traces appear in the
Weave UI and are associated with the corresponding run.

```python
import wandb
import weave

def example_wandb(projname):
    # Split projname into entity and project
    entity, project = projname.split("/", 1)

    # Initialize Weave context for tracing
    weave.init(projname)

    # Define a traceable operation
    @weave.op()
    def say(message: str) -> str:
        return f"I said: {message}"

    # First W&B run
    with wandb.init(
        entity=entity,
        project=project,
        notes="Experiment 1",
        tags=["baseline", "paper1"],
    ) as run:
        say("Hello, world!")
        say("How are you!")
        run.log({"messages": 2})

    # Second W&B run
    with wandb.init(
        entity=entity,
        project=project,
        notes="Experiment 2",
        tags=["baseline", "paper1"],
    ) as run:
        say("Hello, world from experiment 2!")
        say("How are you!")
        run.log({"messages": 2})

if __name__ == "__main__":
    # Replace this with your actual W&B username/project
    example_wandb("your-username/your-project")
```

To use the code sample:

1. In the terminal, install dependencies:

   ```bash
   pip install wandb weave
   ```

2. Log in to W\&B:

   ```bash
   wandb login
   ```

3. In the script, replace `your-username/your-project` with your actual W\&B entity/project.

4. Run the script:

   ```bash
   python weave_trace_with_wandb.py
   ```

5. Visit [https://weave.wandb.ai](https://weave.wandb.ai) and select your project.

6. In the **Traces** tab, view the trace output. Links to any associated runs are shown in the Traces table.

## Configure autopatching

By default, Weave automatically patches and tracks calls to common LLM libraries like `openai`, `anthropic`, `cohere`, and `mistral`.
You can control this behavior using the `autopatch_settings` argument in `weave.init`.

### Disable all autopatching

```python showLineNumbers
weave.init(..., autopatch_settings={"disable_autopatch": True})
```

### Disable a specific integration

```python showLineNumbers
weave.init(..., autopatch_settings={"openai": {"enabled": False}})
```

### Post-process inputs and outputs

You can also customize how post-process inputs and outputs (e.g. for PII data) are handled during autopatching:

```python showLineNumbers
def redact_inputs(inputs: dict) -> dict:
    if "email" in inputs:
        inputs["email"] = "[REDACTED]"
    return inputs

weave.init(
    ...,
    autopatch_settings={
        "openai": {
            "op_settings": {
                "postprocess_inputs": redact_inputs,
            }
        }
    }
)
```

For more details, see [How to use Weave with PII data](../../cookbooks/pii.mdx).

## FAQs

### How do I stop large traces from being truncated?

For more information, see [Trace data is truncated](../troubleshooting.md#trace-data-is-truncated) in the [Troubleshooting guide](../troubleshooting.mdx).

### How do I disable tracing?

#### Environment variable

In situations where you want to unconditionally disable tracing for the entire program, you can set the environment variable `WEAVE_DISABLED=true`.

#### Client initialization

Sometimes, you may want to conditionally enable tracing for a specific initialization based on some condition. In this case, you can initialize the client with the `disabled` flag in init settings.

```python
import weave

# Initialize the client
client = weave.init(..., settings={"disabled": True})
```

#### Context manager

Finally, you may want to conditionally disable tracing for a single function based on some application logic. In this case, you can use the context manager `with set_tracing_enabled(False)` which can be imported from `weave.trace.context.call_context`.

```python
import weave
from weave.trace.context.call_context import set_tracing_enabled

client = weave.init(...)

@weave.op
def my_op():
    ...

with set_tracing_enabled(False):
    my_op()
```

### How do I capture information about a Call?

Typically you would call an op directly:

```python
@weave.op
def my_op():
    ...

my_op()
```

However, you can also get access to the call object directly by invoking the `call` method on the op:

```python
@weave.op
def my_op():
    ...

output, call = my_op.call()
```

From here, the `call` object will have all the information about the call, including the inputs, outputs, and other metadata.
